The scoreboard problem
Ask a founder how the business is doing and you'll hear an ARR number. Ask an investor what they watch and you'll hear NRR, Rule of 40, LTV:CAC, CAC payback. These are the right numbers to report to a board — but they share one property that makes them useless for running the business day to day: they're all lagging. By the time NRR dips or CAC payback stretches past 12 months, the thing that caused it happened weeks or months ago, somewhere further up the funnel.
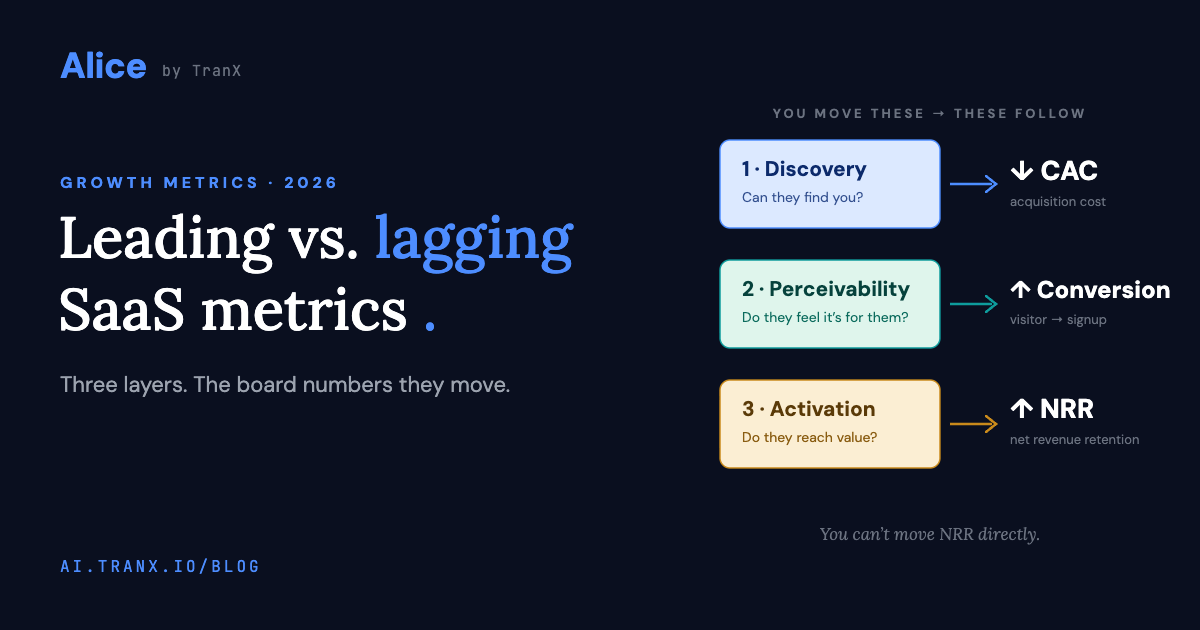
You can't move a lagging metric directly. Nobody wakes up and "does some NRR." You move the leading indicators — the ones that live in three layers of acquisition: Discovery, Perceivability, and Activation — and the board numbers follow. This post maps each layer to the board metric it drives. For the exact metrics and benchmarks inside each layer, the playbook has the full tables; here we're drawing the lines from lever to scoreboard.
Layer 1 — Discovery → CAC
The question: can buyers find you? Discovery has three doors in 2026 — classic search, paid ads, and AI answers (ChatGPT, Claude, Perplexity). The leading metric everyone recognizes is click-through rate: clicks over impressions, cleanest on paid, where it flows straight into CPC → CPL → CAC. Cheaper, higher-quality discovery is a lower CAC.
The overlooked door: AI answers. The fastest-growing discovery channel has no ad account and no dashboard most founders have set up — and it has two blind spots. First, AI-assistant referral traffic: GA4's native "AI assistant" channel is forward-only and undercounts badly, so you have to cross-check the raw session-source host list yourself. Second, whether LLMs describe you correctly — if Claude puts you in the wrong category or quotes the wrong price, you lose deals you never see. Both are Discovery problems: they decide whether you make the buyer's shortlist at all.
Rolls up to: CAC. Every Discovery win lowers what it costs to acquire a customer.
Layer 2 — Perceivability → conversion (and CAC)
The question: after they click, do they feel it's for them? This is the message-match layer — the five seconds between landing on your page and deciding you're worth their time. The leading metrics are engagement rate, bounce rate by source, and visitor-to-signup conversion, all split by where the traffic came from. The single biggest lever is message-match: someone who clicked an ad about "GA4 funnel audit" and lands on a homepage about "AI growth analyst" bounces on cognitive distance alone.
The overlooked mistake: one page for every source. Most founders use the home page as the landing page for all traffic, so the message never matches the intent. A dedicated page converting at 4% beats a home page at 1.5% on the same ad spend — which means Perceivability is quietly a CAC lever too, not just a conversion one. Good perception also earns cheaper discovery, because AI engines recommend the products they can clearly describe.
Rolls up to: conversion rate, and CAC.
Layer 3 — Activation → NRR and retention
The question: do they reach value, fast? Now they've signed up. The leading metric is activation rate — the share of new signups who reach your core "aha" action — with 25–40% the typical band (it varies widely by product complexity). Just as important is activation rate by source: a blended 35% hides the reality that one channel activates at 60% and another at 8%.
The overlooked framing: time-to-value is a revenue metric, not a product metric. Founders file TTV under "product stuff." But a user who feels value in their first session renews and expands; one who's still confused a week later churns. Short TTV directly lifts win rate and NRR. (The playbook sets the operational bar — see its Activation benchmarks.)
Rolls up to: NRR and retention. Activated users stay and expand; the rest leak.
The whole map on one card:
| Layer | Leading metrics | The overlooked one | Moves |
|---|---|---|---|
| Discovery | CTR, CPC/CPL, ROAS & CAC by channel, AI-assistant traffic, AI Overview citations | AI-assistant traffic + do LLMs describe you correctly? | CAC |
| Perceivability | Engagement rate, bounce by source, visitor→signup, scroll depth, mobile LCP | One page used as every landing page | Conversion + CAC |
| Activation | Activation rate (25–40%), time-to-activation, activation by source, trial→paid | Time-to-value as a revenue metric | NRR / retention |
Reading the funnel end to end
The roll-up isn't just three separate pipes. Two cross-cutting reads turn the layers into decisions.
Which channel actually wins. Every founder asks which channel brings the most traffic. Wrong question — a channel sending 10,000 visitors who never activate is worse than one sending 500 who convert and stay. Rank channels on activated users per dollar, tracing each one from Discovery through activation and retention. Watch the attribution trap: B2B journeys are long and multi-touch, so last-touch systematically under-credits the Discovery channels that started the relationship.
Where users drop off. Define the ordered steps — visit → signup → activated → retained → paid — and find the biggest single-step leak. That drop is your highest-leverage fix; nothing else you optimize matters as much. Watch the time between steps too (long gaps are your TTV signal), and segment.
Where the two reads become one: segment the drop-off funnel by channel. Now you don't just know where users leak — you know which channels send you leaky users. A channel with great CTR and terrible activation only looked good until you crossed the two views. Most tools make you assemble this by hand; surfacing it automatically is exactly the cross-layer question an AI growth agent should answer for you.
The payoff
Report ARR and NRR to your board. But run the business on the three layers underneath them. When a lagging metric moves the wrong way, don't stare at the lagging metric — walk up the funnel and find the layer that leaked: Discovery for CAC, Perceivability for conversion, Activation for NRR.
You can't move NRR directly. You move activation, perceivability, and discovery — and NRR follows.
Appendix: the board-metric decoder
Every acronym in this post, what it means in one line, and — the column that matters — which funnel layer is the lever that moves it.
| Term | In one line | Healthy in 2026 | The lever |
|---|---|---|---|
| ARR / MRR | Subscription revenue, normalized per year or month | — (it's the scoreboard) | All three layers |
| NRR | Revenue kept plus expanded from existing customers, net of churn | 100%+; 120%+ is elite | Activation |
| GRR | Revenue kept from existing customers, before expansion masks churn | 85–95% | Activation |
| CAC | Fully loaded sales + marketing cost per new customer | Judge it via payback, not in isolation | Discovery + Perceivability |
| CAC payback | Months of gross profit to earn back what a customer cost | Under 12 months; 6–9 is great | Discovery + Perceivability |
| LTV | Gross-margin profit a customer generates before churning | Judge via the ratio below | Activation (retention) |
| LTV:CAC | Value of a customer vs what they cost to acquire | 3:1 to 5:1 | All three layers |
| Rule of 40 | Revenue growth % + profit margin % | 40+; meaningful at ~$20M+ ARR | All three layers |
| CTR | Clicks ÷ impressions, per ad or search result | 3–5%+ organic non-branded | Discovery |
| CPC / CPL | Ad spend ÷ clicks, or ÷ leads captured | Channel-dependent — watch the trend | Discovery |
| ROAS | Revenue attributed to ads ÷ ad spend | Channel-dependent | Discovery |
| TTV | Signup → first moment of real value | Minutes, not days | Activation |
| LCP | How fast your page visibly loads on mobile | Under 2.5s | Perceivability |
Frequently asked
What's the difference between leading and lagging SaaS metrics?
Lagging metrics report outcomes that already happened: ARR, NRR, Rule of 40, LTV:CAC, CAC payback. They're the right numbers for a board, but you can't act on them directly — by the time they move, the cause is weeks old. Leading metrics are the upstream levers you can pull this week: click-through rate and AI visibility (Discovery), engagement and visitor-to-signup conversion (Perceivability), activation rate and time-to-value (Activation). Move the leading metrics and the lagging ones follow.
Which metrics actually move NRR?
Activation-layer metrics. NRR is retention plus expansion, and both are decided early: users who reach your product's core value quickly (high activation rate, short time-to-value) renew and expand; users who never activate churn. If NRR is slipping, don't stare at NRR — audit your activation rate by source and your time-to-value.
What should I track if I only pick one metric per layer?
Discovery: qualified traffic across organic, paid, and AI answers (with CTR as the efficiency read). Perceivability: visitor-to-signup conversion by source. Activation: activation rate by source. Those three, watched weekly, will surface most funnel problems before they reach the board deck. The playbook has the full 24-metric set when you're ready to go deeper.