The post you wish you'd read 12 months ago
Every week I talk to B2B SaaS founders who've shipped something great and watched it stall. The product works. Early customers love it. Reviews are good. And then growth flatlines, and nobody can tell them why.
The honest answer, almost every time, is the same. They're losing in one specific layer of the acquisition funnel and they don't know which one. They keep throwing budget and energy at the wrong thing because acquisition gets discussed as one big problem ("we need more leads") when it's actually three different problems stacked on top of each other.
This is the playbook I wish someone had handed me 18 months ago. Three layers. The exact metrics that matter in each. The benchmarks for what good looks like in 2026, not 2022. And the action steps you can take this week with no consultant required.
A few ground rules before we start:
- I won't pad with theory. Every section ends with metrics, formulas, and a "what to do this week" line.
- I'll name tools by name. Most are free or cheap. One of them is Alice (the AI growth agent we're building), named in the sections where it solves something specific. The rest of the post stands on its own.
- I'll be honest about what's broken. Attribution doesn't work the way it did in 2020. Your tools' numbers won't agree. I'll tell you how to live with that.
If you're a B2B SaaS founder between $5k and $150k MRR, running growth yourself or with a small team, this is for you.
The model: three layers, not one funnel
Most founders talk about "the acquisition funnel" like it's one thing. It isn't. It's three sequential problems, each with its own metrics, channels, and failure modes.
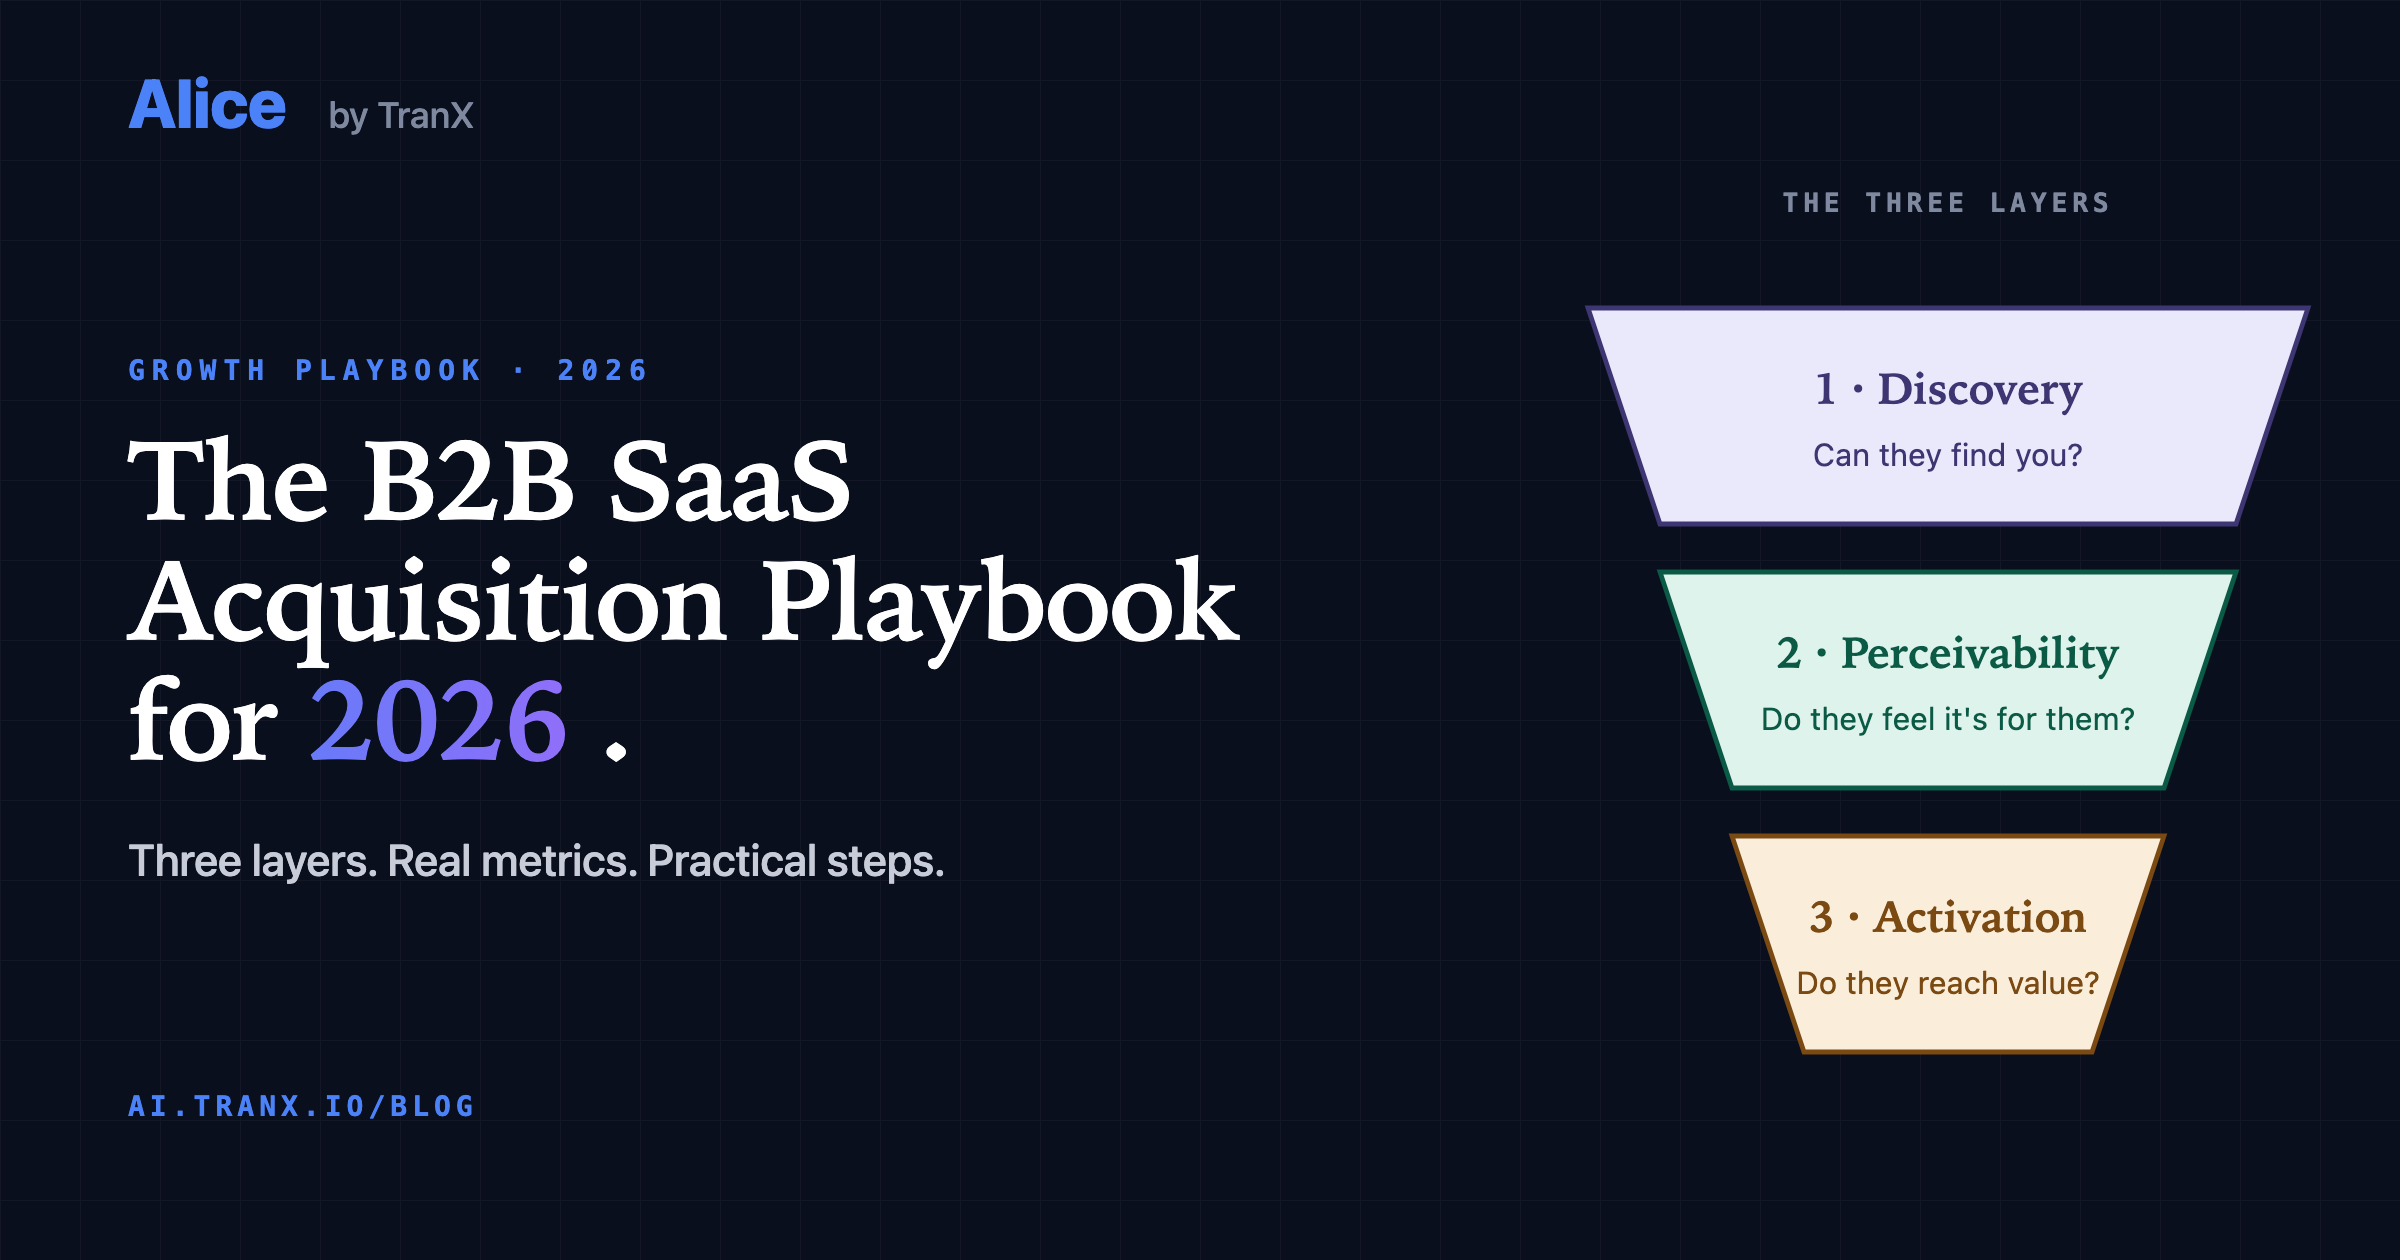
Layer 1: Discovery. Can your customers find you? Google, paid ads, AI answers (ChatGPT, Claude, Perplexity), social, communities. Buyers arrive here, or they don't.
Layer 2: Perceivability. Do they feel it's for them? They saw your ad or search result. They clicked. Did the landing page convince them? Did they engage or bounce? This is where most B2B SaaS funnels leak hardest.
Layer 3: Activation. Do they reach value? They signed up. Did they actually do the thing that makes your product worth paying for? Activation gates everything downstream: retention, revenue, referrals.
Why three layers and not AARRR, HEART, or PLG? Because in 2026, the front of acquisition has fractured into three different channels that work differently (classic search, paid ads, AI answers). Treating discovery as one box was fine in 2010 when there was one door (Google). In 2026 there are three doors, and AARRR has no native home for the third. The three-layer model fixes that.
(If you want the longer argument for why this framework replaces AARRR's "A," read this. And for the strategic view — how these three layers roll up into the board metrics you report, NRR, CAC payback, Rule of 40 — read the companion post: leading vs lagging SaaS metrics.)
The rest of this post walks each layer in detail. For each one, you get:
- What to track
- What good looks like in 2026
- The channels that feed it
- Action steps for this week, this month, ongoing
- The common failure mode
If you only have 20 minutes, jump to the diagnostic below and start with whichever layer you're weakest in.
Step Zero: foundation first, then diagnose
Before you can track which layer you're losing in, you need the two tools every B2B SaaS founder will live in for the next five years: Google Search Console and Google Analytics 4. They're free, every other analytics tool builds on top of them, and 90% of the metrics in this playbook come from one of them.
If you don't have both running, fix that today. Here's the minimum viable setup.
Set up Google Search Console (~15 minutes)
- Go to search.google.com/search-console.
- Add your domain. Pick "Domain" property (covers all subdomains and protocols) over "URL prefix" property. Easier to maintain over time.
- Verify ownership via DNS TXT record (the most reliable method). Add the record to your DNS provider. Propagation takes 1-15 minutes.
- Submit your sitemap. Most CMSes generate it at
/sitemap.xml. In GSC: Sitemaps → entersitemap.xml→ Submit. - Turn on email alerts: Settings → Users and permissions → Email preferences → On.
Wait 48-72 hours for initial data to populate.
Set up Google Analytics 4 (~30 minutes)
- Go to analytics.google.com and create a GA4 property.
- Set up a Web data stream for your domain.
- Install the
gtag.jssnippet on every page. If you use Google Tag Manager (recommended for anything beyond a single landing page), install via GTM instead. - Verify tracking works: open your site in incognito, click around for 60 seconds, then check GA4 → Reports → Realtime. You should see yourself.
- Configure key events (formerly called "conversions"). At minimum, set up:
sign_up— when someone creates an accounttrial_start— if you have a free trialsubscription_purchase— when payment happensfirst_value_event— your activation moment (depends on your product; pick the action that signals "this user got value")
- Link GA4 to Search Console: Admin → Property settings → Search Console links → Link. This is the move that unifies queries with on-site behavior — most founders skip it.
- Set up internal traffic filter: Admin → Data Streams → your stream → Configure tag settings → Show all → Define internal traffic → Add your office and home IPs. Then Admin → Data Filters → Internal Traffic → Activate.
Verification checklist (5 minutes)
Run through these. Any "no" answer means setup isn't complete yet.
- ☐ GSC shows at least 100 impressions in the last 28 days
- ☐ GSC and GA4 are linked (search queries visible inside GA4)
- ☐ GA4 Realtime shows your test visit
- ☐ At least one key event is configured in GA4
- ☐ Internal traffic filter is active
Common setup gotchas
- Tracking installed but no key events. This is the single most common GA4 failure mode. You have data but can't measure anything. Configure events on day one, or every metric in this playbook reads as "(not set)."
- GSC and GA4 not linked. You'll be jumping between dashboards forever. Link them once and save yourself hours per week.
- Internal traffic not filtered. Your team's own visits inflate every metric. New founders frequently celebrate "100 visits today" while 80 of them are the founder reloading the homepage.
- Privacy-mode browsers. Modern browsers block trackers aggressively. Your real numbers are higher than GA4 shows, often by 15-30%. Account for this when reconciling against platform-reported numbers (Stripe, your product DB) later in this playbook.
Once both tools are live and verified, move on to the diagnostic below.
Now diagnose: which layer are you losing in?
This single table is the most important one in the post.
| Symptom you're seeing | Likely broken layer | Jump to |
|---|---|---|
| Low traffic, hard to find your site in search | Discovery | Layer 1 |
| Traffic comes but bounces in under 10 seconds | Perceivability | Layer 2 |
| Visitors stay on the page but don't sign up | Perceivability | Layer 2 |
| Signups happen but nobody activates | Activation | Layer 3 |
| Activated users don't become paid | Activation | Layer 3 |
| Channels work in isolation, but total numbers don't match | Watching | The Watching Discipline |
| All three feel mediocre | Start with Discovery | Layer 1 |
A useful gut check: open the last three weeks of your GA4 and find "engagement rate by source." If bounce rate is high for visitors from a specific channel, that channel's Perceivability is broken (your message and landing page don't match what brought them in). If conversion to signup is high but activation rate is low, your Activation experience is broken (signup gets them in the door but the product doesn't show value fast enough).
Now the layers.
Layer 1 — Discovery: can your customers find you?
What changed in 2026
For 20 years, Discovery meant one thing: rank on Google. In 2026, Discovery has three doors:
- Classic search (Google, Bing). Still huge, but losing clicks to AI Overviews and AI answer engines.
- Paid ads (Google, Meta, LinkedIn). Still the most reliable way to buy attention, but attribution has broken since iOS 14 and the cookieless transition.
- AI answers (ChatGPT, Claude, Perplexity, Google AI Mode). The door nobody was tracking 24 months ago that now decides a growing share of buyer shortlists.
Most B2B SaaS sites have door 1 covered, door 2 partially, and door 3 not at all. The third door is where the easiest wins live right now.
Two recent shifts make measuring Door 3 actually possible. First, GA4 added an "AI assistant" value to sessionDefaultChannelGroup, so referrals from ChatGPT, Claude, and Perplexity can now surface as their own channel instead of hiding inside "Direct" or "Other." One caveat that matters: the native channel is forward-only (no historical backfill), it only recognizes a short list of engines, and it commonly reads zero even when you have real AI traffic. Treat it as a floor, and cross-check by filtering sessions whose source or referrer host is chatgpt.com, perplexity.ai, claude.ai, and the like. Second, third-party tools can now pull Google AI Overview citation data and map it back against the queries already showing in your Search Console. For the first time, you can answer "are buyers finding me through AI, and for which queries?" with real numbers, not a manual sample of 20 ChatGPT prompts.
What to track
| Metric | Formula | Where to find it | How often |
|---|---|---|---|
| Organic impressions | Sum from Search Console | Search Console | Weekly |
| Branded vs non-branded share | branded queries / total queries | Search Console | Monthly |
| Organic click-through rate | clicks / impressions | Search Console | Weekly |
| AI-assisted traffic share | sessions where channel = "AI assistant" / total sessions | GA4 (sessionDefaultChannelGroup), plus a source/referrer host cross-check (forward-only channel undercounts) | Weekly |
| AI Overview citation count | # of your GSC queries where your domain appears in Google AI Overviews, split by branded / non-branded | Third-party tool that maps AI Overview data to your GSC queries (we do this in Alice) | Weekly |
| AI engine citation rate | # of your top 20 buyer-question prompts where you appear in ChatGPT, Claude, Perplexity | Manual sample, or via tool | Monthly |
| Direct traffic share | direct sessions / total sessions | GA4 | Monthly |
| Channel diversity | % of traffic from your largest channel | GA4 | Monthly |
| Cost per visit (paid) | spend / paid visits | GA4 + Ad platforms | Weekly |
| Referring domains | # of unique domains linking to you | Ahrefs / Semrush free tier, or GSC → Links report | Monthly |
What good looks like in 2026
| Metric | Good | Concerning | Investigate |
|---|---|---|---|
| Organic CTR (non-branded) | 3-5%+ | Below 2% | Check title tags, search intent match |
| Organic CTR (branded) | 30%+ | Below 20% | AI Overview may be eating your clicks |
| AI citation rate (top 20 prompts) | 4+ out of 20 (20%+) | 0-1 out of 20 | Site not AI-ready; see action steps |
| Channel diversity | No single channel above 40% | One channel above 60% | Concentration risk |
| Direct traffic share | 20-30% (suggests brand recall) | Below 10% | Brand not sticky yet |
| Referring domains (growth) | +2-5 new domains per month | Flat for 3+ months | No one finds you worth linking to |
These benchmarks are mid-range for healthy B2B SaaS. Top performers exceed them. Early-stage products with no brand will be below them. Use them as a compass, not a verdict.
One more Layer 1 lever worth naming: backlinks. They're unfashionable to talk about, but Google still ranks sites partly on who links to them, and AI engines disproportionately cite sources the broader web already trusts. You don't need an SEO agency. You need 1-2 genuinely useful resources per quarter (templates, datasets, calculators, original research, opinionated benchmarks) that other people in your space actually want to cite. The Google Sheet template paired with this post is an example: anyone who references it links back here. That's a backlink earned, not bought. Don't buy them, build the kind of artifacts people link to.
Channels that feed Discovery, ranked by ROI for solo founders
- Founder-led content (LinkedIn, Twitter/X, Indie Hackers). The cheapest paid media that exists. One hour of writing per week, consistently, has higher ROI than $2,000 of paid ads for most early-stage B2B SaaS. The cost is your time and the willingness to ship.
- AI visibility / Generative Engine Optimization (GEO). The newest channel and the most uncrowded. If your site is technically ready (schema, server-rendered content,
llms.txt, AI crawler access), you're already ahead of 80% of B2B SaaS sites. Most teams haven't even checked. - Pain-point interception. Replying to people who post their problem publicly on Reddit, Indie Hackers, Hacker News, niche Slack groups. Lower volume than ads, but the highest buying intent in this entire list.
- Organic search / SEO. Still works, but only if you write for AI engines as well as Google. Long-tail keywords with thoughtful intent matching.
- Programmatic SEO. If you have a structured database (e.g., "best CRM for [industry]"), this compounds. Be honest about whether you have data worth publishing.
- Paid ads. Reliable if you can measure them honestly (see Reconciliation section). Most founders waste 30-50% of ad spend because attribution noise hides what's actually working.
- Newsletter sponsorships. (Lenny's, Demand Curve, etc.) Targeted, hard to scale, but solid for direct response with the right newsletter fit.
- Partnerships and integrations. Distribution through someone else's audience. Hard to start, compounds when one lands.
Action steps for Discovery
This week:
- Run an AI-readiness check on your site. No tool? Do it manually: open ChatGPT, type "best [your category] for [your ICP]", see if you appear. Repeat in Perplexity and Claude. Note how many of your top 20 buyer-question prompts cite you. If you're under 4 out of 20, you have an AI visibility problem most of your competitors are also losing on — meaning there's room to win.
- Add AI assistant traffic to your GA4 channel report. Go to GA4 → Acquisition → Traffic acquisition → set the dimension to
sessionDefaultChannelGroup. Look for the "AI assistant" row. Most founders find traffic there they didn't know they had. If it reads zero, don't assume you have no AI traffic — the native channel is forward-only and misses most engines. Confirm by filtering sessions whose source or referrer host ischatgpt.com,perplexity.ai,claude.ai, and similar; that host-match number is your real floor. - Cross-reference your GSC queries against Google AI Overviews. For each of your top 20 GSC queries (by impressions), check whether your domain appears in the AI Overview. Note which ones cite you, which cite a competitor, and which AI doesn't cite anyone. This is your AI Overview baseline. (Doing this manually takes 30-45 minutes once; we built Alice to do it continuously, but the manual pass is fine to start.)
- Audit Search Console: which queries already drive impressions you're not capturing clicks on? Those are quick wins (better title tags, better snippets).
- Verify the technical AI-readiness basics: do you have
llms.txt? Schema markup? Server-rendered (not client-side-only) content? AreGPTBot,ClaudeBot, andPerplexityBotallowed inrobots.txt? All of these take an afternoon to fix.
This month:
- Write down your top 20 buyer questions. Not your category SEO keywords — the actual questions your buyers ask when they're trying to solve their problem. Use them as your discovery target list.
- For each, check: do you rank in Google? Are you cited by AI? What does ChatGPT say about your category and which competitors does it recommend? This sample becomes your monthly AI-visibility scoreboard.
- Pick one founder content channel (LinkedIn for most B2B SaaS, Indie Hackers if you fit the bootstrapper community). Publish weekly. The goal is not virality; the goal is consistency.
Ongoing:
- Weekly: track GSC impressions, top queries, organic CTR.
- Monthly: re-test AI citation across your top 20 prompts.
- Quarterly: review channel diversity. If you're more than 40% reliant on one channel, start building the next.
The common failure mode
The single most common Discovery mistake in 2026 is pouring everything into traditional SEO while ignoring AI visibility. Most B2B SaaS sites pass every traditional SEO check (clean schema, fast load, good content) and yet are invisible inside ChatGPT and Perplexity for the questions their buyers actually ask. Their Google traffic is slowly declining (because AI Overviews are eating clicks) and their AI visibility is zero, and they don't realize either is happening until revenue stalls.
The second most common mistake: relying on one channel. Founders who do "100% paid ads" or "100% SEO" build fragile growth that collapses the moment the channel changes (Google update, ad platform price hike, iOS privacy bump). Diversify before you need to.
Layer 2 — Perceivability: do they feel it's for them?
What changed in 2026
Attention has compressed. The data shows the first 3-5 seconds on a landing page decide whether the visitor stays or bounces, and they're more aggressive about bouncing than ever. Three things have changed since 2022:
- Privacy-mode browsers now block visitor recording on 25-30% of sessions. Your heatmap and session recording tools are showing you a partial picture. Account for this when reading the data.
- AI-trained visitors expect conversational tone. Pages that read like 2018-era marketing copy ("Empower your team with our cutting-edge platform") get bounced harder than ever. Pages that sound like a person explaining a problem get attention.
- Mobile is 60%+ of B2B SaaS site traffic. A landing page that's beautiful on desktop and broken on mobile is broken, period.
The single biggest Perceivability lever in 2026 is message-match between source and landing page. The visitor clicked an ad about "GA4 funnel audit." They expect to land somewhere that says "GA4 funnel audit" within 5 seconds. If they land on a homepage about "AI growth analyst," they bounce. The cognitive distance kills the click.
What to track
| Metric | Formula | Where to find it | How often |
|---|---|---|---|
| Engagement rate | (GA4 calculated metric) | GA4 | Weekly |
| Bounce rate by source | bounces / sessions, split by source | GA4 | Weekly |
| Time on landing page | average for top 5 pages | GA4 | Weekly |
| Scroll depth (50% / 90%) | % of visitors past those marks | Hotjar / MS Clarity / GA4 events | Monthly |
| Visitor → signup conversion | signups / visitors, split by source | GA4 + your product DB | Weekly |
| CTA click rate | primary CTA clicks / page views | GA4 events | Monthly |
| Page load (mobile) | LCP (Largest Contentful Paint) | PageSpeed Insights | Monthly |
What good looks like in 2026
| Metric | Good | Concerning | Investigate |
|---|---|---|---|
| Engagement rate | 60%+ on landing pages | Below 45% | Page-source mismatch or weak hook |
| Visitor → signup (free trial) | 2-5% | Below 1% | Probably both Discovery and Perceivability |
| Visitor → signup (paid demo) | 1-2% | Below 0.5% | Hook-to-CTA path broken |
| Scroll depth past hero | 60%+ | Below 40% | Headline isn't earning the scroll |
| Mobile page load (LCP) | Under 2.5s | Over 4s | Web Vitals work needed |
| Bounce-rate gap (paid vs organic) | Under 15 points | Over 25 points | Paid ads landing on wrong pages |
The conversion benchmarks vary widely by category. A free-trial SaaS at $99/mo with a low-friction signup hits 3-5%. A high-touch enterprise SaaS with a sales demo hits 0.5-1.5%. Calibrate against your specific category, not the universal averages.
Pages (not channels) that feed Perceivability
Perceivability isn't fed by channels the same way Discovery is. It's fed by your pages, and the channels you already invested in deposit traffic onto those pages. The pages you need to audit:
- Home page. The catch-all that almost always under-converts because it can't speak to one specific intent.
- Per-channel landing pages. Dedicated pages for ad campaigns, partnership traffic, podcast guest spots. The most under-built asset class in B2B SaaS.
- Pricing page. Converts more visitors than founders realize, and almost nobody A/B tests it.
- Founder / About page. Visitors arriving from Reddit, LinkedIn, or IH commonly check who's behind the product. Treat it as a conversion page, not a vanity page.
- Docs / Getting Started. Decides whether technical buyers stay or close the tab.
Action steps for Perceivability
This week:
- Run the 5-second test on your home page and top landing pages. Show the page to someone who's never seen it for exactly 5 seconds. Hide it. Ask: "What does this company do? Who's it for? What do you click next?" If they can't answer all three, the page is failing.
- Test mobile rendering. Open every key page on your actual phone (not browser devtools). Look for: hero CTA above the fold, text readable without zoom, forms that work with one thumb.
- Install Microsoft Clarity (free) or Hotjar (free tier). Get heatmaps and session recordings running.
This month:
- Watch 20 real session recordings. Not the polished walkthroughs — the messy real ones. Notice where people pause, where they rage-click, where they leave.
- Identify your top 3 paid ads. For each, audit the landing page they point to. Does the landing page repeat the ad's specific promise within the first 5 seconds? If not, build a tailored landing page. The work pays for itself in 2 weeks of ad spend.
- Run one A/B test on a CTA or headline. The free options: VWO Free, Convert.com free tier, or split test manually if you're early. The single highest-leverage test for most B2B SaaS: change "Sign up free" to a verb that names the outcome ("See your funnel," "Find what's broken").
Ongoing:
- Track engagement rate by source weekly. A drop on one source signals a page-source mismatch you can usually fix in an hour.
- Run one conversion experiment per month. Three rules: change one variable at a time, give it 2 weeks minimum, only test things you have a real hypothesis about.
- After every paid campaign launch, check whether the landing-page conversion rate is at least as good as organic. If paid converts worse than organic, the landing page isn't holding up its end.
The common failure mode
The single most common Perceivability mistake: using the home page as the landing page for every traffic source. Visitor clicked an ad about "GA4 funnel audit" and lands on a homepage about "AI growth analyst." The cognitive distance between expectation and reality is enough to bounce them, even when both pages are talking about related products.
The fix is per-campaign landing pages with matched message. Most founders skip this because it sounds like more work than they have time for. The math: a dedicated landing page converting at 4% beats a home page converting at 1.5% across the same ad spend by 2.7x. Three hours of landing-page work pays for itself in two weeks.
The second most common mistake: trusting GA4's bounce rate alone. With 25-30% of sessions privacy-blocked, your real engagement is higher than reported. Don't make decisions on a single metric. Cross-reference GA4 engagement, heatmap scroll data, and session recordings together. The combined picture is more honest than any one of them.
The catch: maintaining that cross-reference manually every week is a part-time job. Most founders give up after the first three weeks. We'll come back to this in the Watching Discipline section.
Layer 3 — Activation: do they reach value?
What changed in 2026
Activation is the layer that's most product-specific and least standardized. What "reaching value" means depends entirely on what your product does. But three things have shifted across the whole category:
- Time-to-value expectations have compressed. B2B SaaS buyers, especially founders running their own growth, expect to see value in the first session — not after a 30-day onboarding sequence. Products that require setup before any value gets shown lose people in the first 90 seconds.
- AI has trained buyers to expect "show me the answer." They signed up because they want a specific outcome: clarity, a number, a finding. The faster you deliver one tangible result, the more likely they activate. The "watch a demo video, then explore the dashboard" flow is bleeding users.
- Activation by source matters more than overall activation. A 35% activation rate hides reality. Reddit traffic might activate at 60%; a generic Google ad might activate at 8%. Until you split activation by source, you don't actually know which channels are worth scaling.
What to track
| Metric | Formula | Where to find it | How often |
|---|---|---|---|
| Activation rate | activated users / signups | Product analytics (Mixpanel / June / PostHog / GA4 events) | Weekly |
| Time to activation | median time from signup to activation event | Product analytics | Weekly |
| Day 7 retention | users active D7 / users signed up D0 | Product analytics | Weekly |
| Day 30 retention | users active D30 / users signed up D0 | Product analytics | Monthly |
| Activation rate by source | activation rate split by traffic source | Product analytics + GA4 | Monthly |
| Trial → paid | paid users / trial signups | Product DB + Stripe | Weekly |
| Time to first revenue | median days from signup to first payment | Product DB + Stripe | Monthly |
What good looks like in 2026
| Metric | Good | Concerning | Investigate |
|---|---|---|---|
| Activation rate | 25-40% (varies wildly by product) | Below 15% | Activation event might be the wrong one |
| Time to activation | Under 5 minutes | Over 30 minutes | Onboarding friction; remove steps |
| Day 7 retention | Above 40% | Below 20% | Product not sticky; what would make it stickier |
| Trial → paid | 15-25% | Below 8% | Either price or perceived value |
| Activation gap by source | Best vs. worst within 2x | More than 5x gap | Some channels bring tire-kickers |
Time-to-activation under 5 minutes sounds aggressive but is increasingly the bar in 2026. Buyers who don't see value in their first session usually don't return.
Where Activation breaks (it's almost never the product)
When founders investigate low activation, they assume the product needs more features. It almost never does. The actual culprits, in order:
- The activation event isn't defined. You can't track what you haven't named. Most founders pick "completed onboarding," which is too vague to act on.
- Onboarding has too many steps. Each step loses 15-25% of users. Five steps = you've lost most signups before they reach value.
- Value is hidden behind setup. "Connect your data, then we'll show you something useful" makes the setup itself the value barrier.
- No moment of truth in session one. User signs up, sees a blank dashboard, closes the tab. The product needed to show one concrete result inside the first session.
- Channel mismatch. Activation is fine for some sources, terrible for others. The terrible sources are bringing the wrong buyer.
Action steps for Activation
This week:
- Define your activation event in one sentence. Specific enough that you could count it. "User connected at least one data source AND ran one query" beats "user activated." If you can't write the one-sentence definition in 5 minutes, that's the work for this week.
- Test your own onboarding as a stranger. Create an account with a new email. Time how long until you see something useful. If it's over 5 minutes, that's your immediate fix.
- Pull activation rate from the last 30 days. Even a rough estimate. You need a baseline to improve from.
This month:
- Split activation by source. Connect product analytics with GA4 source data. Look for channels with sub-10% activation — that traffic is buying you nothing.
- Remove one onboarding step. Pick the most-skipped step in your funnel and either delete it, defer it, or auto-complete it.
- Build a "first 60 seconds" experience. What's the one concrete thing a brand-new user should see in their first session that proves the product works on their data? Build toward that single moment.
Ongoing:
- Weekly: activation rate, time-to-activation.
- Monthly: activation by source. This is the single most under-tracked metric in B2B SaaS, because it requires reconciling product data with traffic data — and almost no founder has time to do that manually every week.
The common failure mode
The single most common Activation mistake: treating all signups equally. Founders see a 25% activation rate and try to fix it across the board, when 60% of signups from one source activate fine and 5% from another source never do. The fix isn't a better onboarding for everyone — it's killing the bad source, or building a different onboarding flow for it. You can't see that pattern until you split activation by source.
The second most common mistake: measuring activation in the wrong unit. Activation isn't "did they finish onboarding," it's "did they reach value." If your "onboarding complete" event happens before any actual value moment, you're measuring whether people clicked through a tutorial, not whether your product worked for them.
The Watching Discipline: who's actually doing all this?
This isn't a fourth layer of the funnel. The funnel has three (Discovery, Perceivability, Activation). The Watching Discipline sits above the funnel: it's the work of measuring whether the first three layers are actually working. Different category, equally important.
If you've read this far, count what running this playbook actually means each week:
- 10 metrics in Layer 1 (Discovery) across GSC, GA4, and your ad platforms
- 7 metrics in Layer 2 (Perceivability) across GA4, heatmap tool, and your CMS
- 7 metrics in Layer 3 (Activation) across product analytics, Stripe, and GA4
That's around two dozen metrics across 7 tools — roughly a dozen you check weekly, the rest monthly. Plus the quarterly strategic review. For most founders running their own growth, this is the moment of honesty: they're not actually doing it.
Three real problems live under that metric count.
Problem 1: Your sources don't agree
Google Ads will report 47 conversions this week. GA4 will report 41. Your product database will report 38. Stripe will report 35. None of them are wrong individually. They're measuring slightly different things with different attribution windows and identity-resolution rules. (For the deeper dive on each disagreement, see your Google Ads ROAS looks great, your GA4 tells a different story and GA4 vs. GSC: two tools, one funnel, endless confusion.)
The honest reality: until you reconcile these into one source of truth, you can't answer "what's working." You can only answer "what each tool thinks is working." Most founders give up here and trust their gut, which is wrong often enough that they're regularly surprised when they finally do the reconciliation work.
Problem 2: The watching itself is a part-time job
Two dozen metrics across 7 tools is roughly 2-3 hours of pure data-pulling each week, before you've drawn a single conclusion. Founders who try this for the first 3 weeks of a quarter and then never again aren't lazy — they're rational. The cost is too high for what the dashboards return.
The result is a familiar pattern: founders track 4-5 metrics they can pull in 15 minutes and ignore the rest. The twenty they ignore include the ones that would actually surface what's breaking.
Problem 3: Leak detection happens too late
Even if you're checking weekly, you're seeing leaks too late. A Day 3 activation drop becomes visible on a Day 7 review. A campaign bleeding budget for 4 days won't show up until Friday's check-in. By the time you notice, the damage is done.
Real leak detection is proactive: something watches every metric every day and alerts you the moment one moves outside its normal range. That's an analyst's job. It's not a dashboard's job.
What "good" looks like for the watching layer
If you wanted to run this playbook properly with no help, here's what your week would look like:
- 30-60 min daily: scan critical alerts (paid spend anomalies, signup drops, error spikes)
- 2-3 hrs weekly: pull and reconcile the metrics due that week, write a brief on what's changed
- 2-4 hrs monthly: deeper investigation into anomalies the weekly pass surfaced
- 1 day quarterly: review channel mix, retention cohorts, strategic adjustments
Roughly 8-12 hours per week of growth analysis. Most founders have 2 hours, max.
This is the gap that exists in every B2B SaaS team between $5k and $500k MRR: the analysis that should happen, doesn't, because the founder ran out of time. The growth that's possible doesn't materialize because nobody's watching closely enough to catch the leaks.
Where Alice fits
Most founders end up tracking 4-5 of the metrics in this playbook because manually watching two dozen across 7 tools every week is a part-time job nobody hired for. That's why we built Alice.
Alice is an AI growth agent that does the work the playbook expects you to do:
- Watches every metric in this playbook 24/7 across Search Console, GA4, Google Ads, Meta, Stripe, BigQuery, SQL, and CSV. No more bouncing between dashboards.
- Pulls Google AI Overview citation data for the queries you already rank for in GSC. For the first time, you can answer "are we cited in AI Overviews, for which queries, branded or not" with continuous data, not a one-time manual sample.
- Surfaces AI-assistant traffic from GA4 alongside everything else, so Door 3 stops being a black hole.
- Reconciles when sources disagree. Google Ads reports 47 conversions, GA4 says 41, Stripe says 35. Alice tells you which is closest to the truth and why.
- Correlates events with traffic. Tell her when you ship a blog post, run a campaign, post on LinkedIn, or change the pricing page. She logs it and tells you which traffic and signups actually showed up because of it. The kind of correlation work that takes a human analyst hours, done in seconds.
- Emails you the moment something moves outside its normal range, so leaks get caught on day 1, not day 14.
She's not a dashboard. She's the analyst doing the work the dashboard expects you to do.
Free check at ai.tranx.io. Drop your URL, see what comes back.
The 30/60/90 day roadmap
You've now read three layers, ~24 metrics, and dozens of action steps. Here's how to actually do it without burning out.
Three phases. Each one builds on the last. If you only have time for one of them, do Days 1-30.
Days 1-30: Foundation
The goal isn't to fix everything. The goal is to know what's broken, and to set up the tooling that lets you fix it later. Most founders skip this and start "doing growth" with a broken measurement layer underneath. Don't.
| Layer | Do this in days 1-30 |
|---|---|
| Discovery | Set up GSC and GA4 (Step Zero). Add sessionDefaultChannelGroup to your weekly GA4 review. Run an AI-readiness check on your site. Cross-reference your top 20 GSC queries against Google AI Overviews. |
| Perceivability | Run the 5-second test on your home page and top 5 landing pages. Install Microsoft Clarity or Hotjar (free tier). Test mobile rendering on a real phone. |
| Activation | Define your activation event in one sentence. Time your own onboarding from a fresh email. Pull your current activation rate from the last 30 days. |
| Watching | Build a metrics dashboard in your own Google Sheet using the structure below. Fill in your current numbers. Identify your weakest layer. |
Days 31-60: Depth
The diagnostic from days 1-30 surfaced your weakest layer. This phase goes deep there. Don't try to fix everything at once.
| If your weakest layer is… | Days 31-60 focus |
|---|---|
| Discovery | Pick one founder content channel (LinkedIn or IH). Publish weekly. Fix AI readiness basics (llms.txt, schema, server-rendered content). Write content for three buyer questions you currently lose to competitors. |
| Perceivability | Build per-channel landing pages for your top 2 paid campaigns. Run your first A/B test (CTA or headline). Watch 20 real session recordings on your top page. |
| Activation | Split activation rate by source. Remove one onboarding step. Build the "first 60 seconds" experience that delivers one concrete result inside session one. |
| Watching | Set up your weekly review ritual: 60 minutes every Friday, same time. Update the dashboard, write a 3-sentence brief on what changed. |
Days 61-90: Compound
Now you're working on a second layer while the first one compounds.
| Layer | Days 61-90 focus |
|---|---|
| Discovery | Add a second discovery channel. Track AI Overview citations monthly. |
| Perceivability | Second A/B test. Mobile-only audit on your top 3 pages. |
| Activation | Reduce time-to-activation by another step. Check trial → paid by source. |
| Watching | Reconciled measurement: GSC + GA4 + Stripe in one view. Alerts set up for the metrics that matter most. First quarterly review of channel mix. |
How to actually do this
Three rules that decide whether the playbook works:
- Pick one layer, not three. Trying to fix Discovery, Perceivability, and Activation simultaneously means you fix nothing. Pick the weakest one and go deep.
- The 60-minute Friday ritual is non-negotiable. Same time, same place, every week. The discipline of weekly review is what turns metrics into decisions.
- Stop adding tools. GSC + GA4 + Stripe + one heatmap tool + one product analytics tool is enough. The playbook fails because of effort, not because of tooling.
The metrics dashboard, five tabs
The single highest-leverage thing you can do this week is build a metrics dashboard in your own Google Sheet and start filling it in. Every metric in the playbook, every formula, every source, with space for your numbers and targets. Five tabs:
- Layer 1 — Discovery (10 metrics: impressions, branded share, CTR, AI-assisted traffic share, AI Overview citations, AI engine citation rate, direct share, channel diversity, paid CPV, referring domains)
- Layer 2 — Perceivability (7 metrics: engagement rate, bounce by source, time on page, scroll depth, signup conversion by trial type, CTA click rate, mobile LCP)
- Layer 3 — Activation (7 metrics: activation rate, time to activation, D7 retention, D30 retention, activation by source, trial → paid, time to first revenue)
- Weekly Review — a one-page weekly check-in (60 minutes every Friday)
- Events Log — what you shipped (blog post, campaign, LinkedIn post, pricing change) with dates, so you can correlate cause and effect later
How to use it:
- Once: set up the tabs, fill in your current numbers (rough is fine).
- Weekly: spend 60 minutes updating the numbers and writing the review brief.
- Monthly: review trends, write a longer note.
- Every time you ship something: log it in the Events tab.
After 12 weeks of weekly updates, you have a trend dataset most founders don't have. That's when patterns become visible: which weeks moved the needle, which campaigns mattered, which experiments worked.
If running this manually every week sounds like too much (it is, for most founders), Alice does the watching work automatically. She pulls every metric, reconciles when sources disagree, correlates events you log with the traffic they drove, and emails you what changed. Free check at ai.tranx.io.
Frequently asked
How is B2B SaaS acquisition different in 2026 versus 2024?
Three things changed in the last 24 months. First, AI search engines (ChatGPT, Claude, Perplexity, Google AI Overviews) became a real source of buyer discovery, splitting what used to be "Google traffic" into multiple distinct channels. Second, privacy regulations and browser changes broke traditional attribution: your tools' numbers now disagree by 15-30%, and most founders haven't adjusted. Third, attention compressed: visitors decide in 3-5 seconds whether your landing page is for them. The playbooks that worked in 2024 still apply at the margins, but the three-layer model (Discovery, Perceivability, Activation) is the cleaner way to think about acquisition now.
What's the biggest mistake B2B SaaS founders make in 2026?
Pouring all their growth budget into one layer (usually Discovery) while ignoring the other two. A founder will spend $5,000/month on Google Ads while their landing page converts at 0.8% (Perceivability problem) and their activation rate is under 15% (Activation problem). They're losing 95% of the buyers the ads paid to find. The fix isn't more ad spend — it's diagnosing which layer is leaking and fixing that one first. Most founders get faster results from a 3-hour landing page rewrite than a $5,000 ad budget increase.
How do I track AI visibility for my B2B SaaS site?
Three steps. First, set up GA4 with the AI assistant channel: go to Acquisition → Traffic acquisition → set the dimension to sessionDefaultChannelGroup and look for the "AI assistant" row. The native channel recognizes ChatGPT, Gemini, Copilot, Deepseek, and Grok — but leaves out Claude and Perplexity (they still land in Direct/Referral), and it's forward-only, so it undercounts and often reads zero. Treat it as a floor and cross-check by filtering sessions whose source or referrer host is chatgpt.com, perplexity.ai, or claude.ai. Second, check Google AI Overview citations by cross-referencing your top GSC queries against what shows in AI Overviews for those queries. Third, manually sample 20 buyer-question prompts in ChatGPT, Claude, and Perplexity to see if you appear. Tools that automate steps 2 and 3 exist (we built Alice for this). Doing it manually takes about 45 minutes per month.
What's a good CAC payback period for B2B SaaS in 2026?
Under 12 months is healthy. 6-9 months is great. Above 18 months means either your CAC is too high or your LTV is too low (or both). For founders running their own growth between $5k and $150k MRR, the bigger problem is usually accurate CAC calculation: most attribution is broken enough that founders are looking at a CAC number that's 20-30% off from reality. Get the measurement right (reconcile across GA4, ad platforms, and Stripe) before optimizing the number.
What's a good activation rate for B2B SaaS?
25-40% is typical for B2B SaaS, but it varies wildly by product complexity. A simple product (sign up → connect one source → see value) hits 40-60%. A complex product (sign up → invite team → import data → configure → first value) hits 10-20%. More important than the absolute number: track activation rate by source. A 35% overall activation rate hides reality if 60% of one channel activates fine and 5% of another channel never does. Until you split by source, you don't know which traffic is worth scaling and which traffic is wasting budget.
Do I need separate analytics tools for each funnel layer?
You can run the whole playbook with GSC + GA4 + Stripe + one heatmap tool (Hotjar or Microsoft Clarity, both free tiers) + one product analytics tool (Mixpanel, June, or PostHog all have free tiers). That's enough. The bigger problem isn't the number of tools, it's whether anyone is actually watching them all every week. That's the work most founders don't have time for, and it's where Alice (or any AI growth analyst doing the watching layer) earns its keep.
I only have time for one thing this week. What should I focus on?
Open your last 30 days of GA4. Find the engagement rate by source. If bounce rate is high (over 60%) for most sources, you have a Perceivability problem: fix your landing pages first. If engagement is fine but signups are low, fix your CTA and value proposition. If signups happen but nobody activates, fix onboarding. If your problem is "nobody finds my site at all," that's Discovery: set up GA4 properly first, then audit AI visibility. Pick the most painful symptom and start there.
What's GEO (Generative Engine Optimization)?
GEO is the equivalent of SEO for AI answer engines. It's the practice of making your content, schema, and site structure citable by ChatGPT, Claude, Perplexity, and Google AI Overviews. Key tactics: structured data (schema markup), llms.txt file, server-rendered content (not client-side-only React), allowing AI crawlers (GPTBot, ClaudeBot, PerplexityBot) in robots.txt, and writing content that directly answers buyer questions in plain English. GEO matters because a growing share of B2B buyers ask AI engines before they ever open Google. If AI cites your competitor and never mentions you, that buyer is gone before you knew they existed.
Is AARRR still relevant for B2B SaaS in 2026?
Mostly yes. Four of AARRR's five stages (Activation, Retention, Referral, Revenue) still hold up. The exception is the first A, Acquisition. AARRR treats it as a single box, but in 2026 acquisition has split into three distinct sub-problems (Discovery, Perceivability, Activation in the acquisition sense) with different metrics and channels. The 3-layer model in this playbook is a replacement for AARRR's Acquisition stage, not the whole framework. The rest of AARRR still applies. Read the longer argument →
Closing
Acquisition has changed. The playbooks from 2022 stopped working in 2024, and the founders who kept running them are now wondering why growth has stalled. The three-layer model — Discovery, Perceivability, Activation — is the operating manual for the 2026 reality.
Three things to do this week, in order:
- Set up GSC and GA4 properly (Step Zero). Verify the checklist.
- Run the diagnostic. Find which layer is broken.
- Build the metrics dashboard. Fill in your numbers.
That's the whole start. Everything else compounds from there.
If you want help with the watching layer — the work the dashboard expects you to do — try Alice. Free check at ai.tranx.io.